Problem
Inspection systems generate large volumes of CSV, bitmap, and DAT output. Engineers need to review repeatability, spatial drift, coplanarity, and pin-level risk — often offline, often under production pressure, and often without a unified analytics tool.
Approach
- Monitor folders recursively for InspectionResults and PinsFound CSV families.
- Parse and cache pin-level data for low-latency dashboard responses.
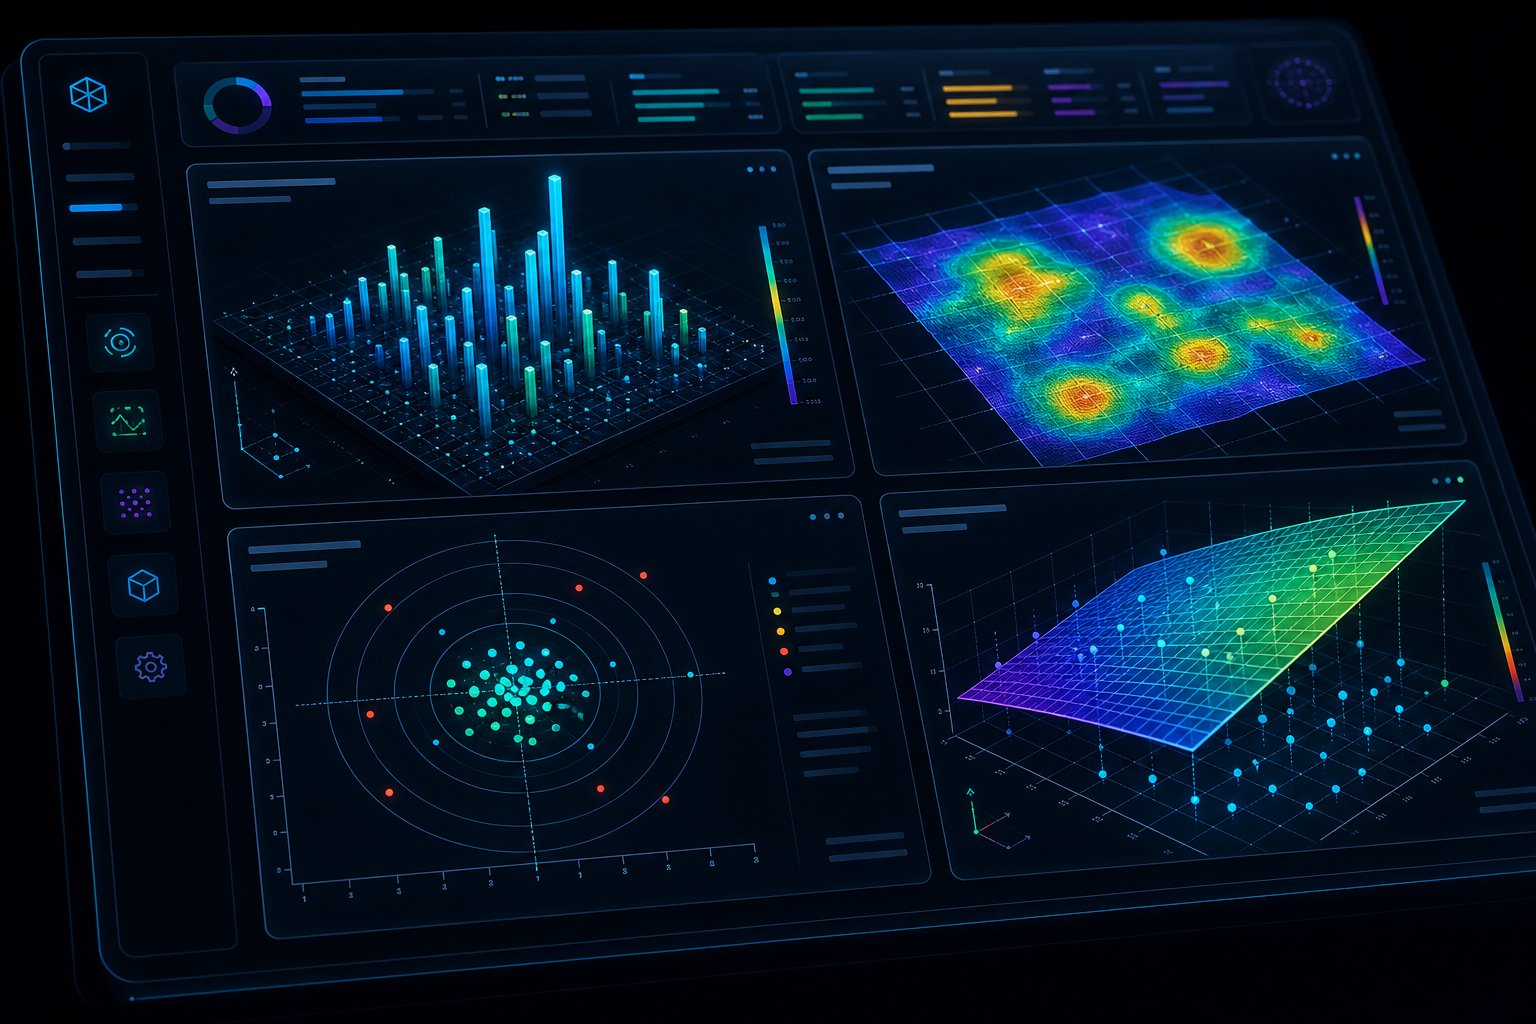
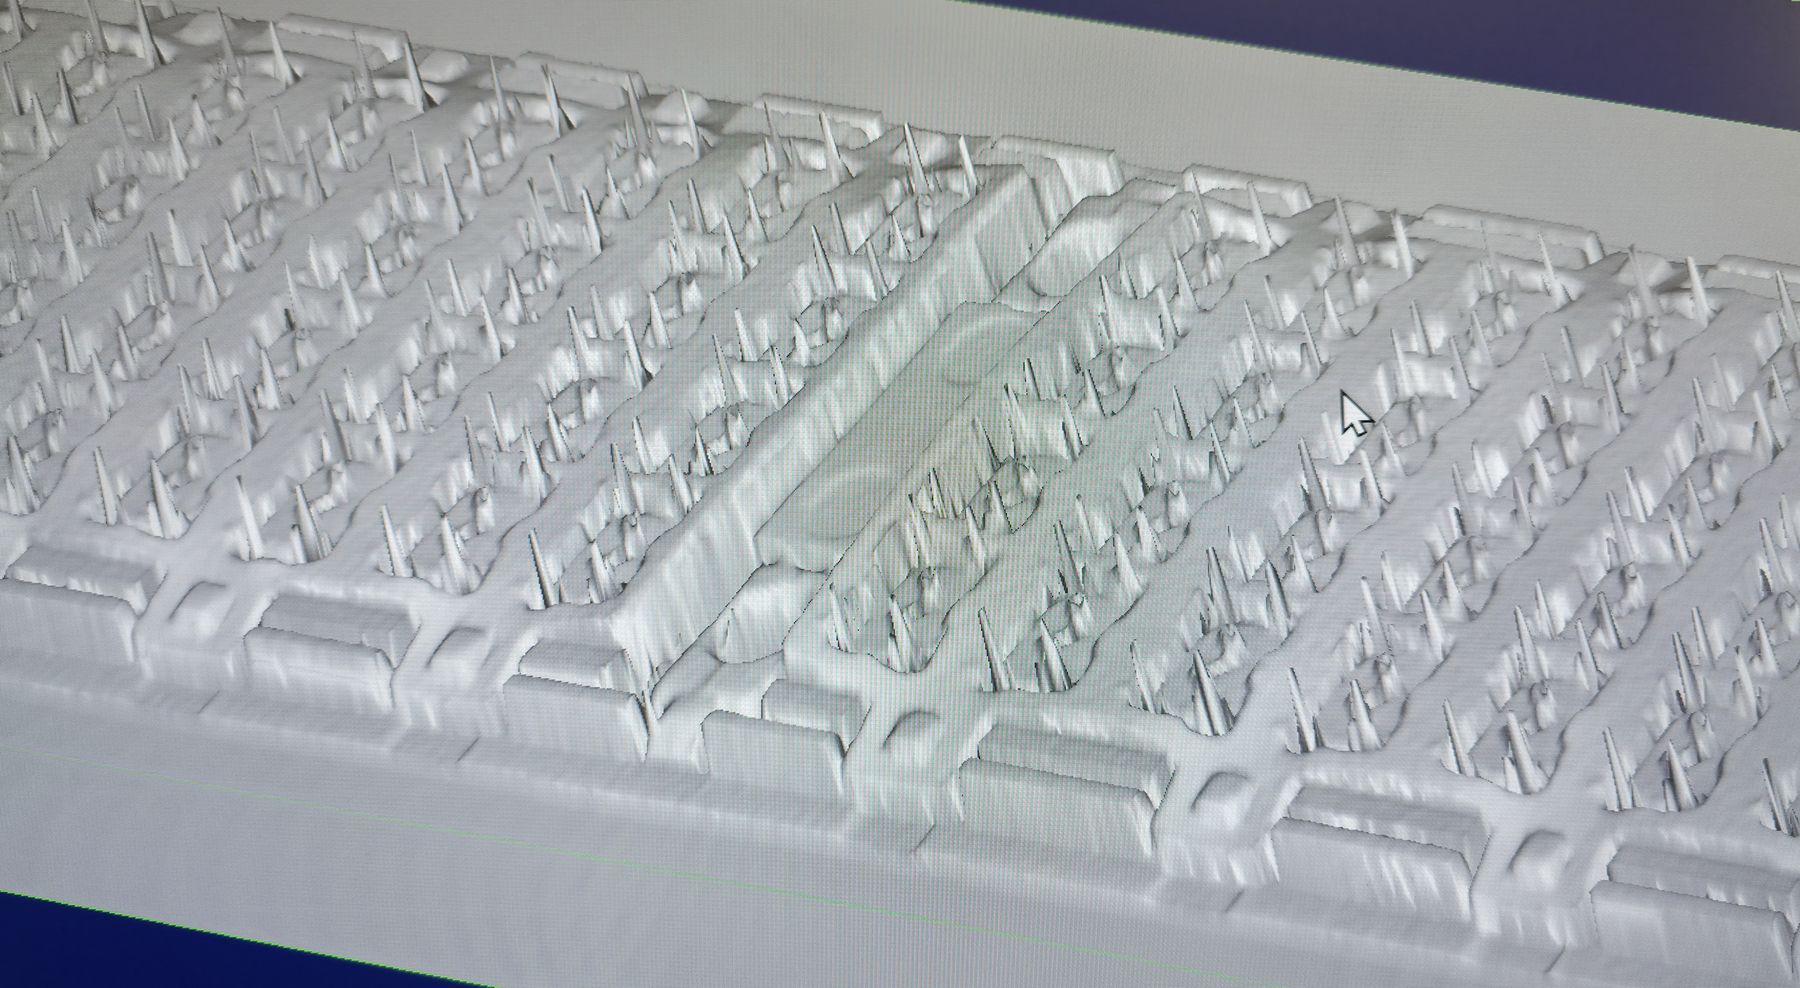
- Render spatial heatmaps, 3D coplanarity/seating-plane views, and tolerance-ring pin maps.
- Compare sources across platforms with best-fit registration and drift timelines.
- Export shareable interactive HTML reports and printable customer views.
Result
A self-contained analytics suite that closes the loop between raw inspection output and customer-reviewable acceptance — supporting validation workflows, defect drilldowns, and production-quality intelligence.
120µm
Pin map rings
12+
Analytics tabs
Offline
Factory-ready
My role
Sole designer and developer — architecture, CSV/DAT parsers, the in-memory inspection cache, every visualization (ECharts + ECharts GL), the report-export pipeline, licensing and customer/internal mode gating, and the in-app wiki and help system.
Stack